
EHR Insight
Hospital dashboards, with the detail just a click away.
EHR Insight puts operational dashboards first, with interactive charts, shared filters, daily grids, and supporting data in the same workspace. Governed self-service reporting remains available for deeper analysis across SQL Server, Azure SQL Database, and PostgreSQL.
Dashboard Focus
Interactive
Explore trends and open supporting data without losing dashboard context.
Reuse
Personal
Reuse shared tiles, resize charts, and snap your layout into place.
Control
Auditable
Group and individual permissions control access and exports.
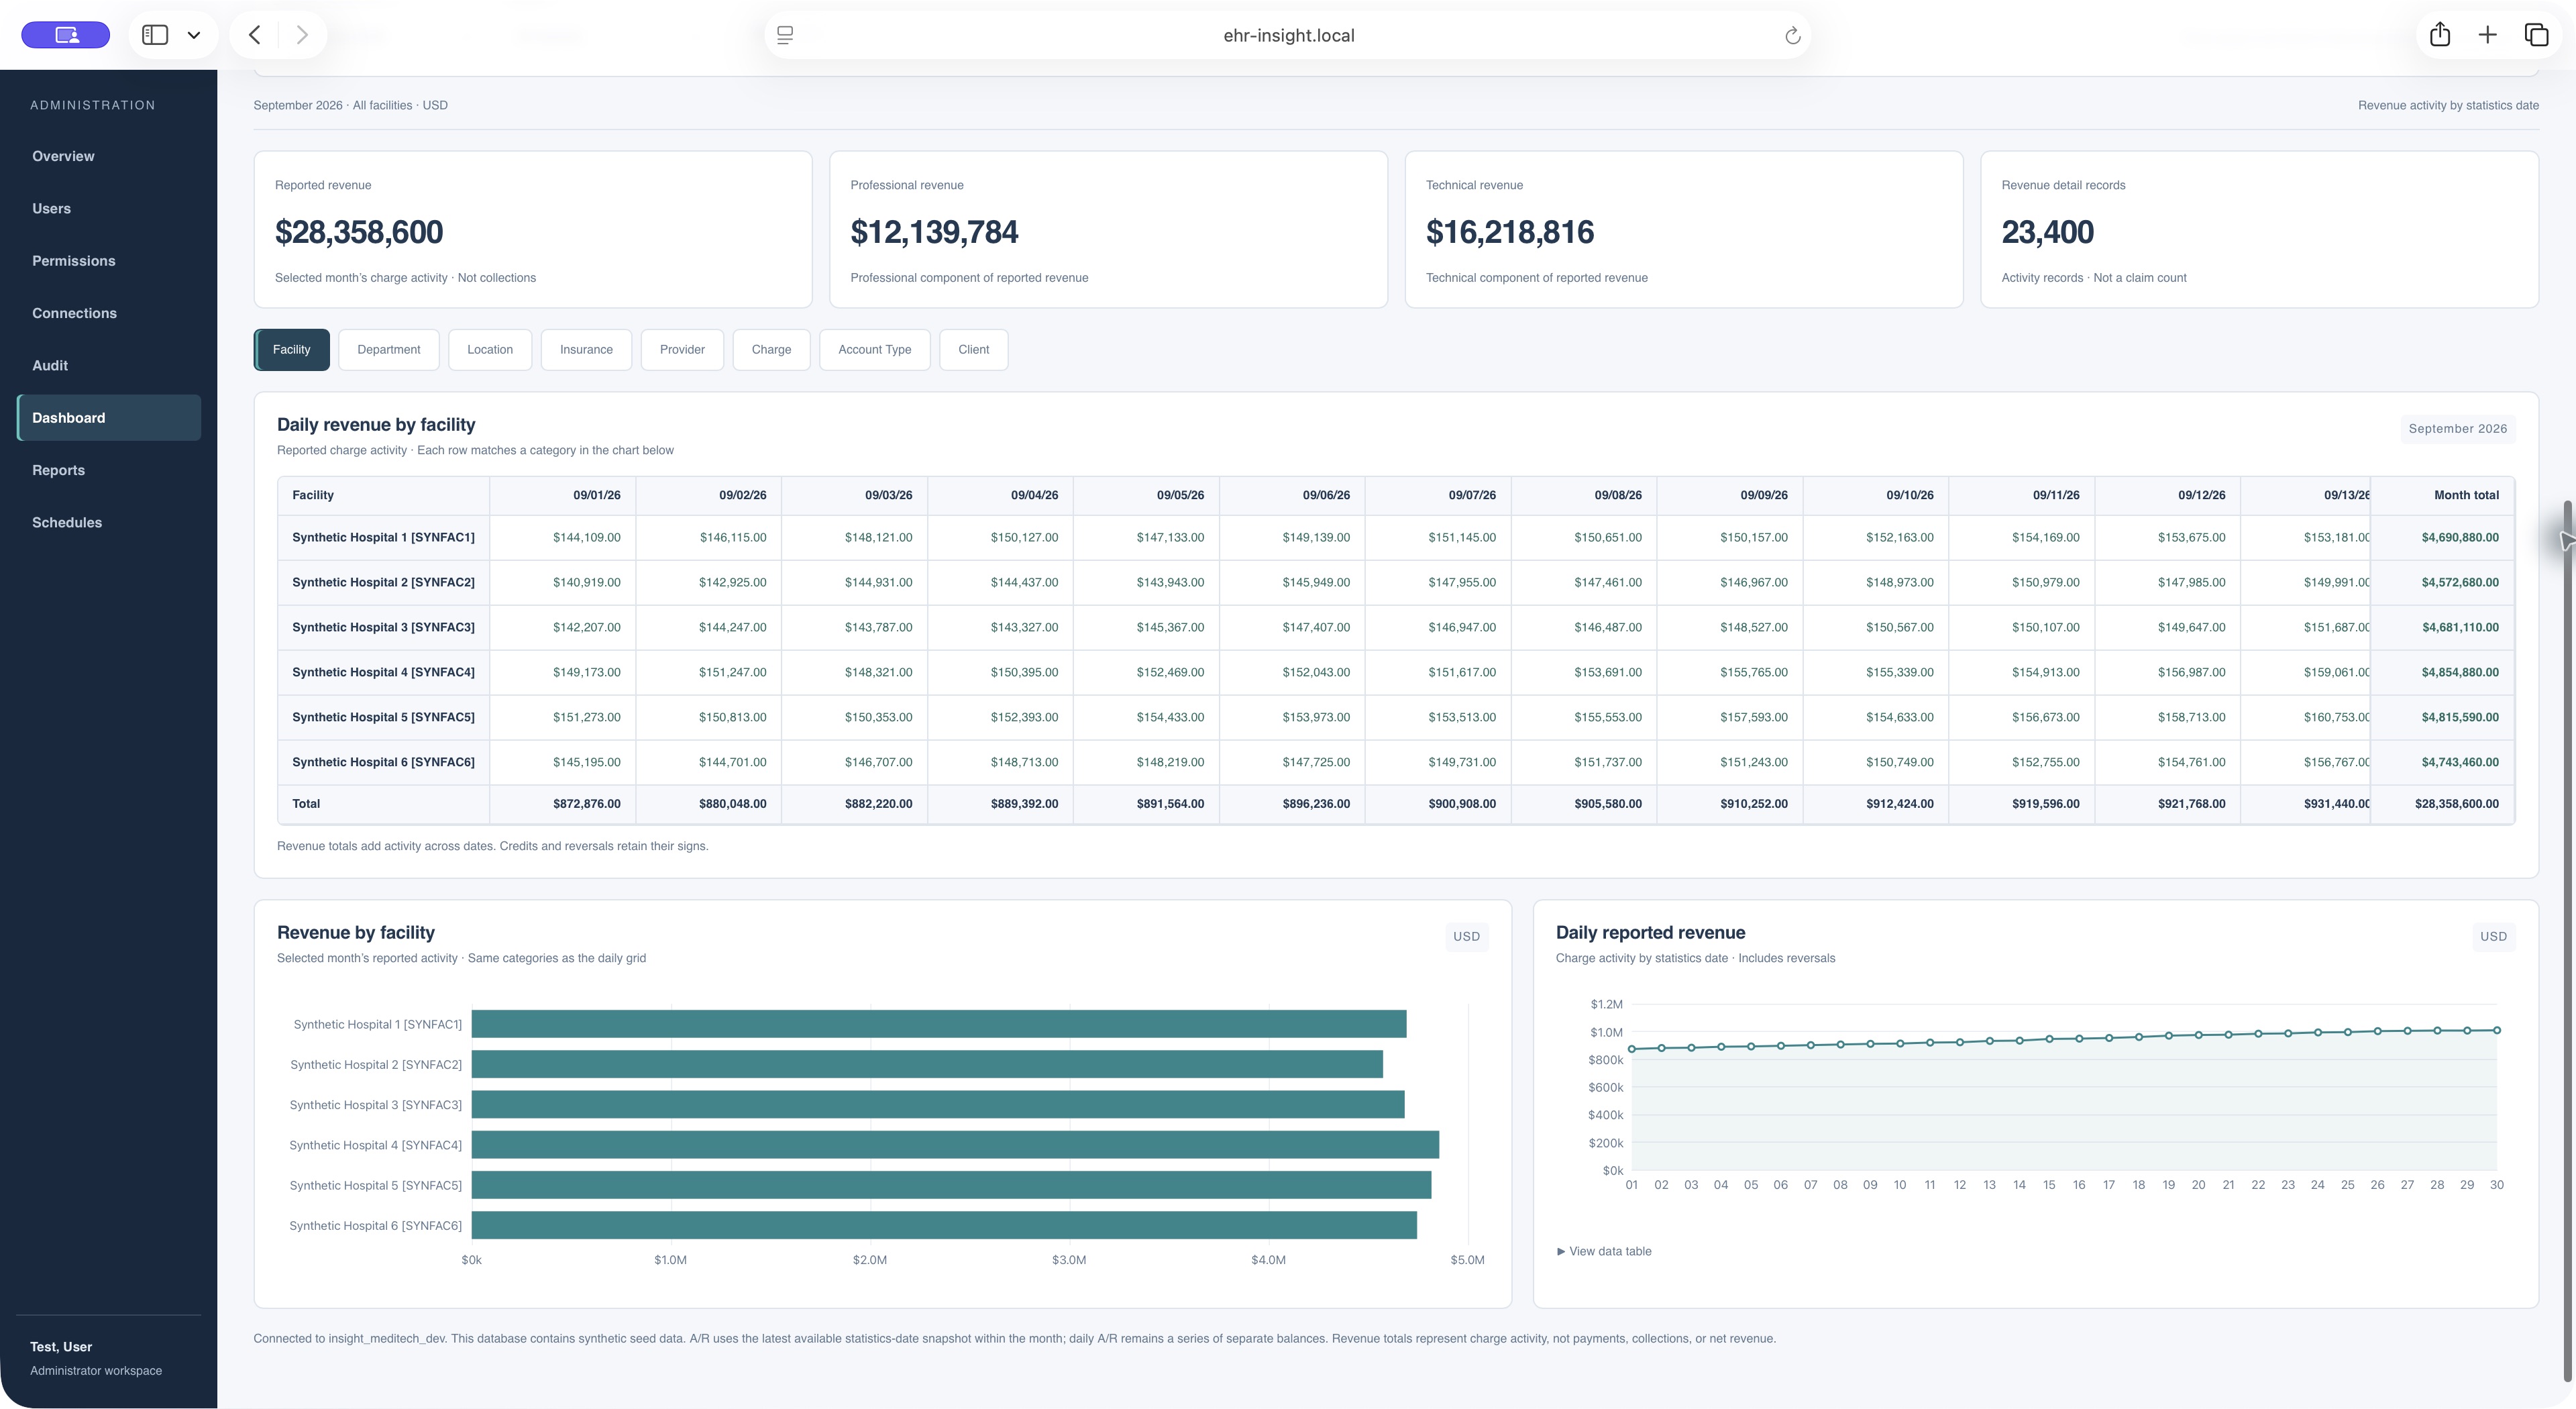
Revenue dashboard with synchronized month and facility filters, daily totals, and chart views. Synthetic demonstration data.
Revenue Cycle Workspace
Separate measurements. A connected view.
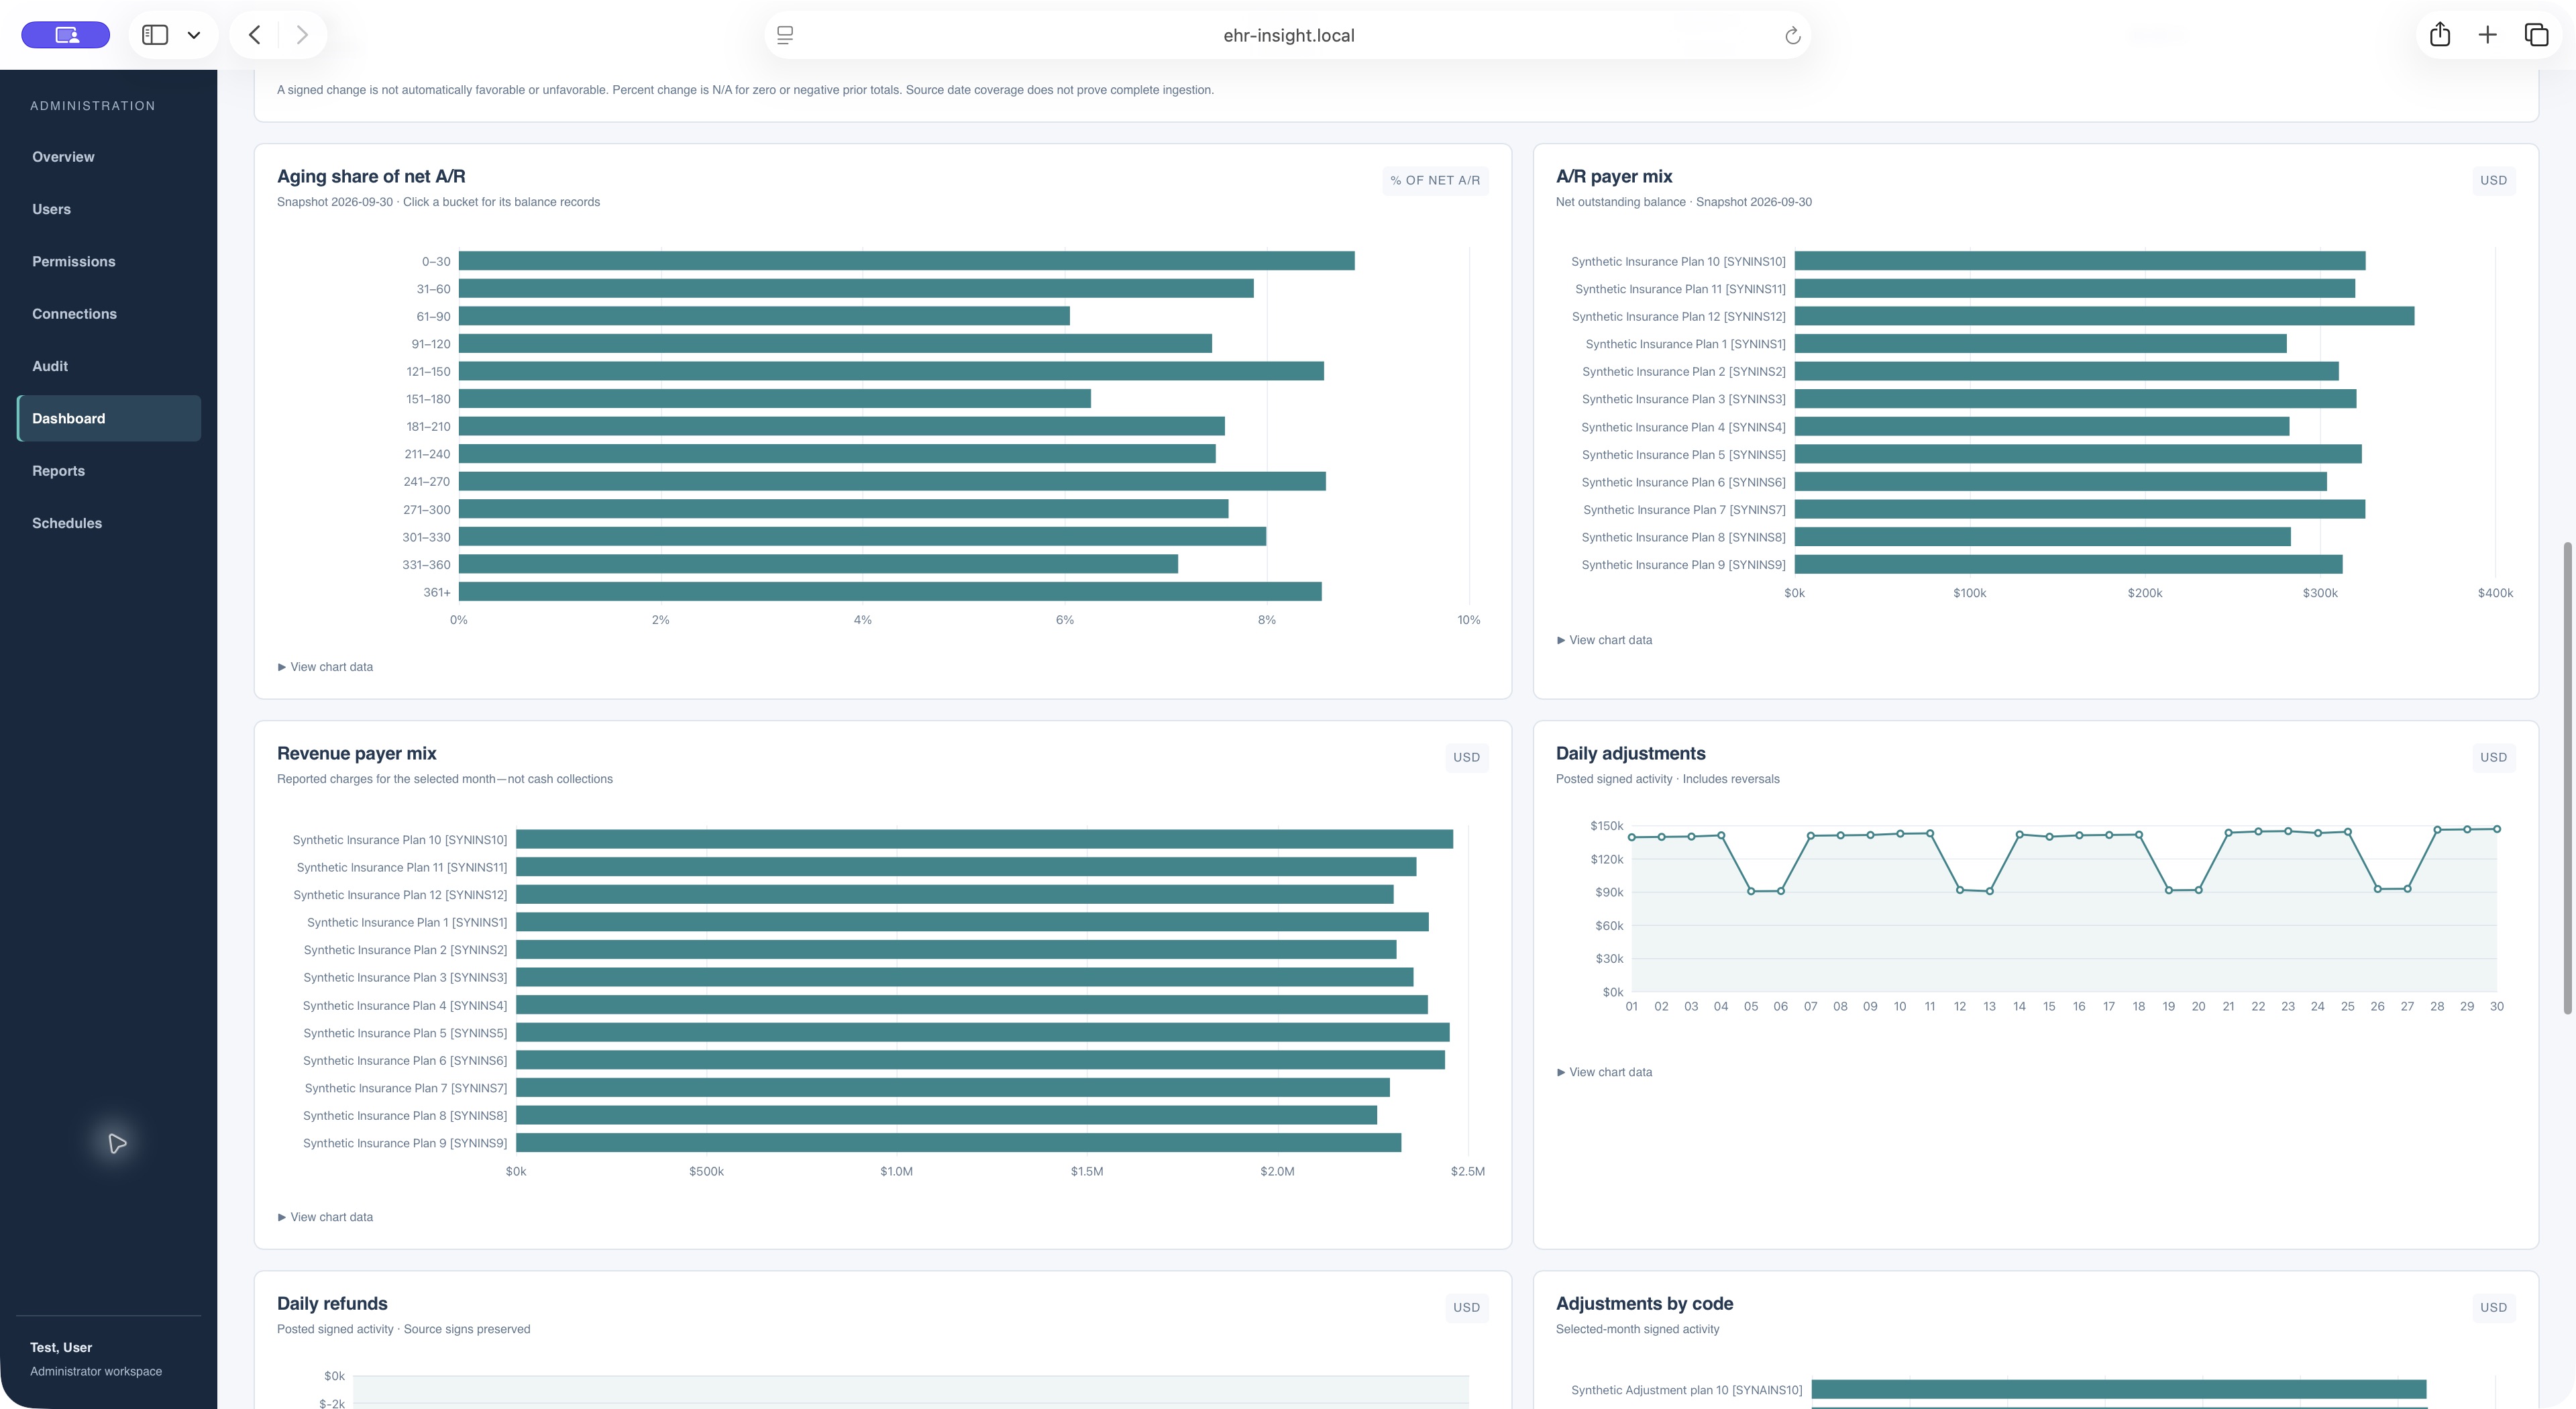
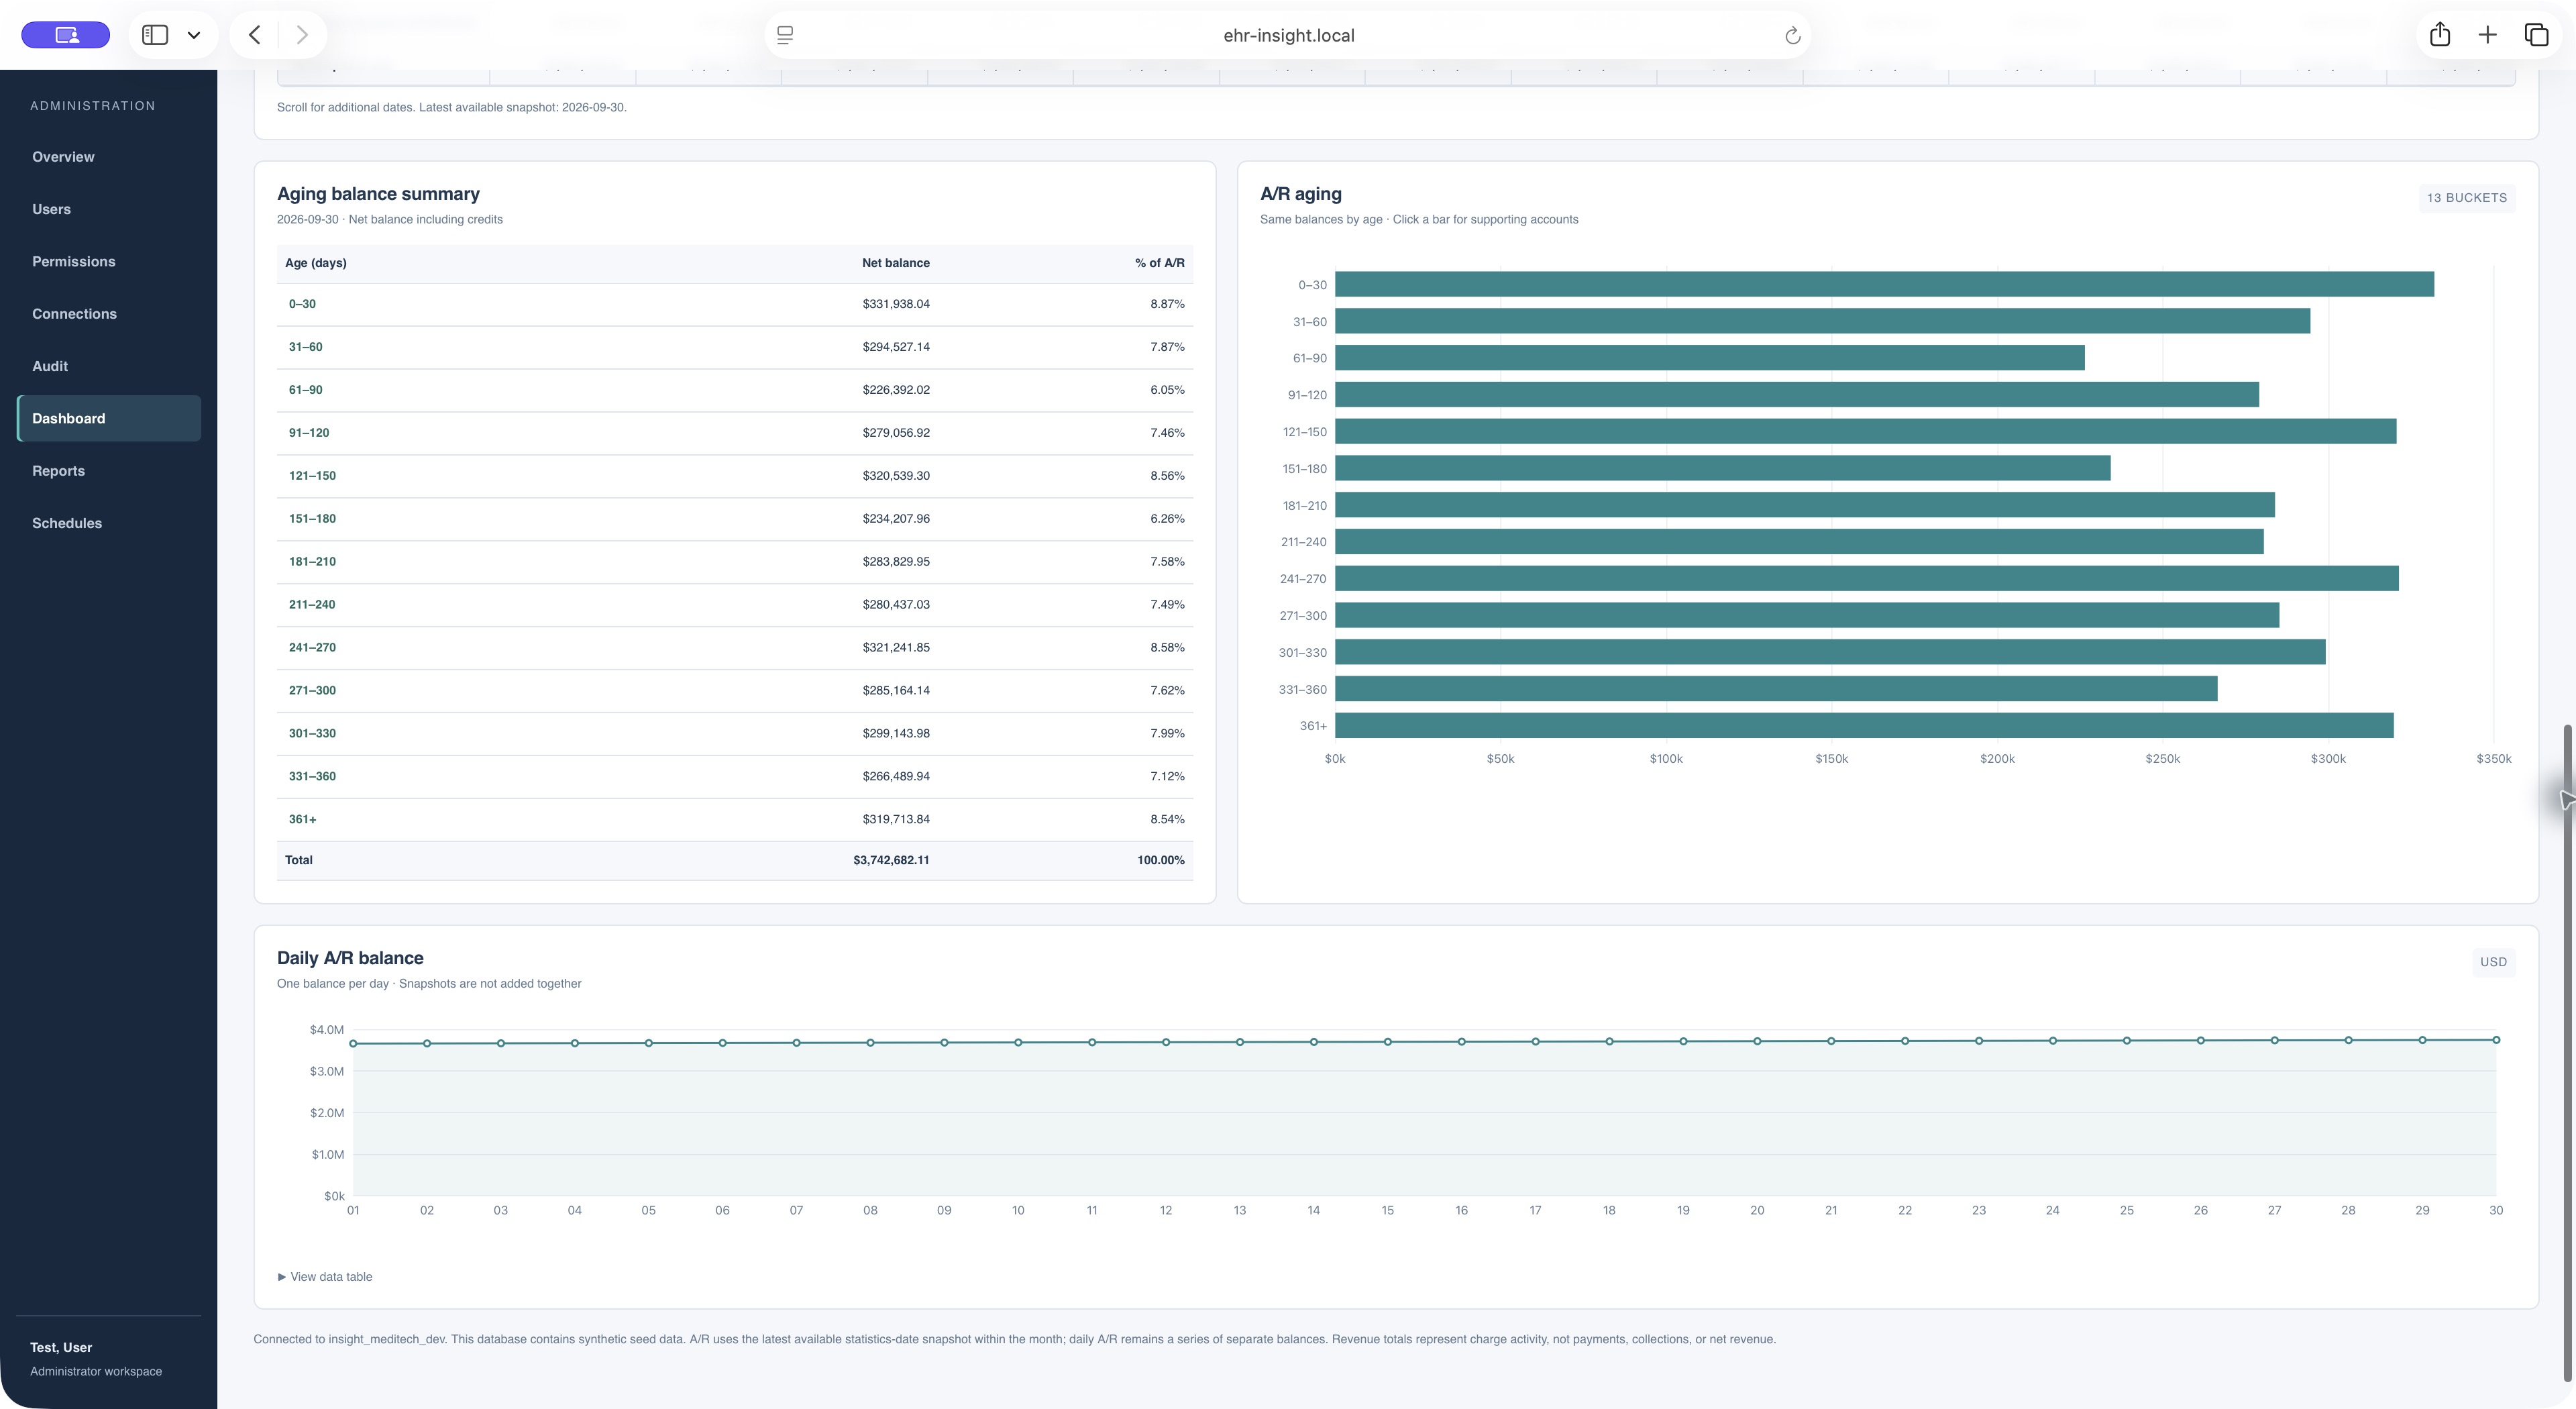
Navigate Overview, Revenue, Accounts Receivable, Payments, Adjustments, Refunds, and A/R Days within the Revenue Cycle workspace. Shared month and facility filters keep the selected context consistent.
Capabilities
What teams actually use day to day.
Interactive Charts and Supporting Data
Open supporting data in a dashboard panel. Authorized users can export bounded CSV detail without navigating away.
Personal Dashboards and Shared Tiles
Search published tiles for your connection and add an editable personal copy. Resize and position tiles on a persistent snap grid. Sharing never grants access to the underlying report.
A/R Days and Daily Grids
Review A/R days by total, facility, or insurance, choose the averaging period, and compare daily values alongside cash flow, revenue, and aging measures.
Self-Service Reporting When You Need It
Build reports from approved connections and objects with selected fields, filters, grouping, and sorting. Save reusable definitions and export results where permitted.
Administrative View
Trusted by IT because governance is part of the workflow.
Administrators create groups with inherited connection, object, and report access, then apply individual permissions where needed. View and export access can be controlled separately, including global and selective export restrictions.
Group Defaults, Individual Control
Give department members a consistent starting point while retaining direct grants and user-specific restrictions.
Permission-Aware Reuse
Published tiles remain subject to underlying connection, object, report, and export permissions.
Next Step
When reporting demand becomes recurring delivery work, move into Insight Pipeline.
Analysts often start with ad hoc work, and operational teams later need those outputs delivered on a schedule. Insight Pipeline is built for that next step.